

Reports
![]()
There are various report headers as above, each of them returning the following reports:
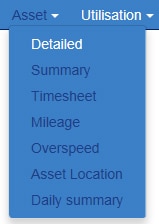
Under Asset reports the above are available as standard. If other reports are required then these can be requested from our Support Team who will log your request and take it through the process to delivery.
- Detailed Report – this report is used generally by our support staff as it shows all events from the device and allows analysis in depth of what the unit is doing. It shows line by line every event we receive.
- Summary Report – this report shows every start and stop and a summary of totals for that specific journey. It further provides the standing time between journeys that could indicate time on site/job.
- Timesheet Report – this is a macro level report that summarizes the vehicles use per day and is most commonly used to verify manually submitted timesheets.
- Mileage – this simply returns the asset name (VRN) and the number of miles driven within the selected period.
- Over Speed – this report allows the end user to define a date period and a “speed over” value i.e. 70 MPH. The report will bring back all events above the selected speed.
- Asset Location – this report allows the selection of a date and time range, a postcode and distance from said postcode. This allows you to see if an asset was within a specified distance of the postcode at a certain time and date. This is useful to protect drivers from claims from the public of poor driving etc.
- Daily summary – this is the same as the summary report but in a different format.
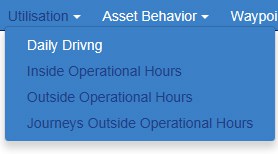
- Daily Driving – breaks down the driver’s day by total journey time, idle time and driving time. This allows at a glance the end user to identify excessive idle and analyzes differences between driving times for assets.
- Inside Operational Hours – once operational working hours are set up, this report will contain all totals within the set working hours.
- Outside Operational Hours – this will contain all journey totals outside of the set working hours and total up the driving time and miles driven.
- Journeys Outside Operational Hours – this report drills down to journey level and displays each journey outside of operational hours.
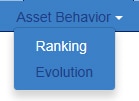
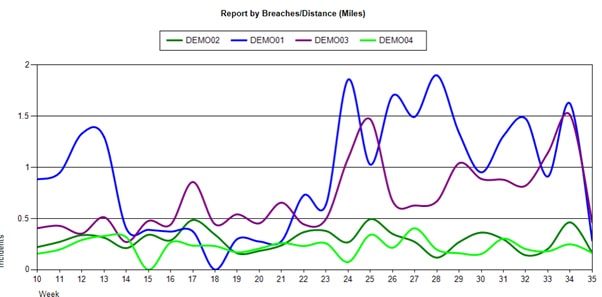
- Ranking – the ranking report is a mixture of data and graphs, with 3 options for the user to select. Breaches are an incident of harsh braking, accelerating or cornering, and we also include idle after 1 minute as a breach. The 3 report options are arranged by number of breaches, breaches divided by the driving time, or breaches divided by the number of miles driven. Select the assets dates, your chosen option and the report will rank your drivers best to worst, as well as clearly identifying in a bar graph the aspects of their driving that need to be improved.
![dashboard-reports-asset-performance]](https://www.amsgroupusa.com/wp-content/uploads/2015/10/dashboard-reports-asset-performance.jpg) \
\ - Evolution – this report identifies long term trends, with the same 3 selection options as the Ranking Report. It is designed to be run in conjunction with driver education, as experience shows that the better this is managed, the more money is saved in fleet costs.
- Visits per Asset – this report will identify any waypoint that a selected asset(s) has visited in the user defined time period. Waypoints are created under Admin>Waypoints>Manage Waypoints.
- Visits per Waypoint – this report will identify any assets that have visited a selected waypoint.